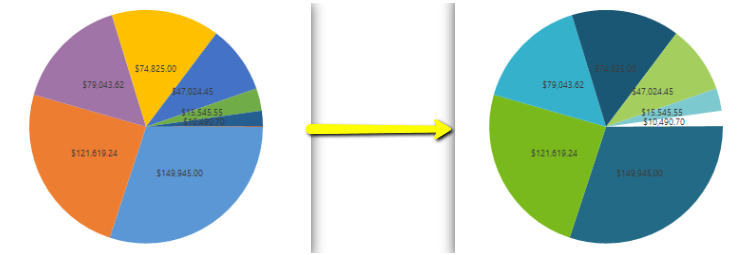
Our start and end result
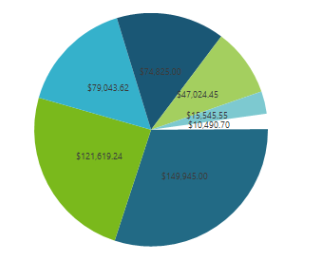
This is the chart for which i need to change the color palette
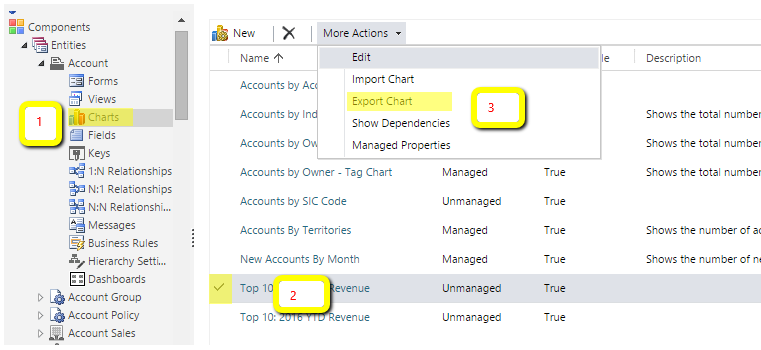
Exports the chart
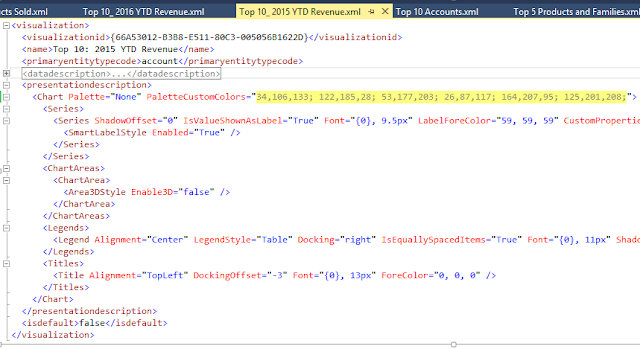
After exporting open the chart XML file in Visual studio or Note pad and replace your own color palette in the below highlighted area and save the chart xml file.
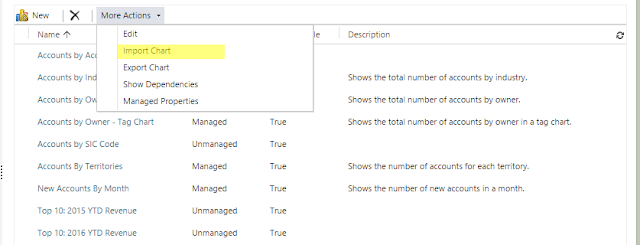
In CRM solution click on the Import chart button as shown below:
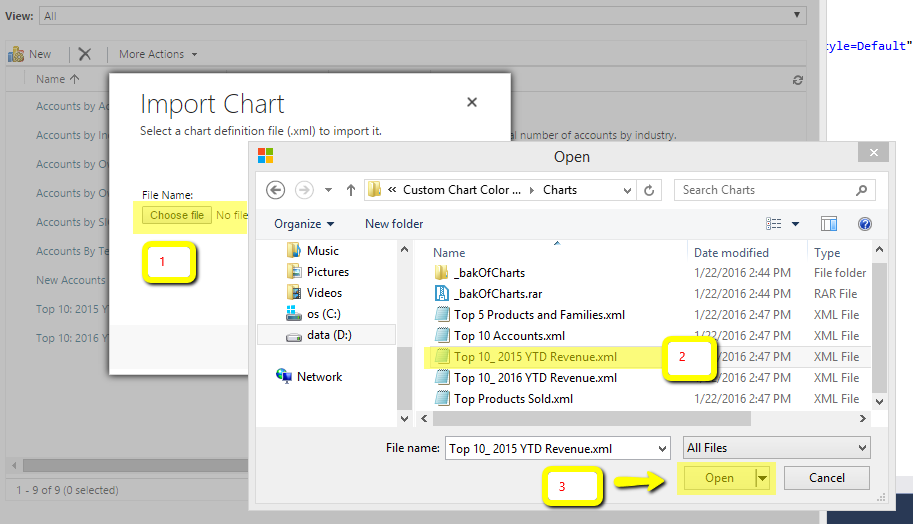
Browse and select your updated chart XML file:
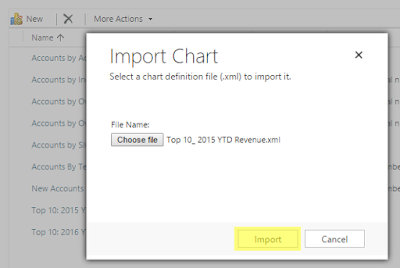
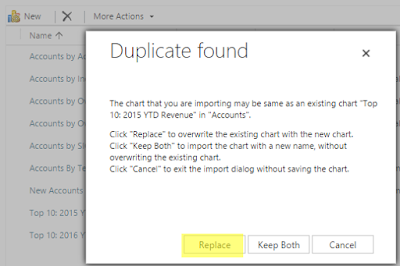
Click Import button
Click Replace button to update the existing chart
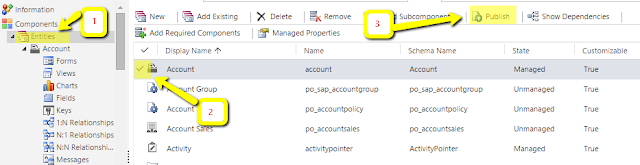
Published the entity that contains the chart
Refresh your chart in dashboard OR in the entity main grid page